

Canadian real estate has entered a bear market as monetary stimulus fades. BMO Capital Markets wrote to clients to explain home sales fell further in July. Falling sales helped inventory recover, resulting in a balanced market. It’s not expected to stop there, as provinces like Ontario show rare weakness. This has the bank seeing the market erode further in the coming month.
Canadian Real Estate Demand Is Cooling, Helping Inventory Recover
Rising rates and falling Canadian real estate sales helped boost months of inventory. The seasonally adjusted inventory of unsold homes reached 3.4 months in July, up from 3.1 months in June. It’s almost twice the 1.7 months at the start of the year, the bank emphasized.
“That’s getting back close to the much calmer conditions prevailing just before the pandemic when they were a bit above 4 months’ supply,” said Douglas Porter, the bank’s chief economist.
Canadian Real Estate Is A Balanced Market, But Getting Worse
The sales to new listings ratio (SNLR) helps to make more sense of this trend. This is the ratio of homes sold compared to the number listed for sale. Right around 50 percent is balanced. If the ratio rises above 60 points, the market is a “seller’s market,” where prices tend to rise. Below 40 percent and the market is considered a “buyer’s market,” and prices tend to fall.
“A metric that’s a bit more concerning for the near-term outlook is the ratio of sales to new listings, which has plunged to just above the 50 [percent] level after holding well above a record high 75 [percent] for all of 2021,” explains Porter.
Ontario Real Estate Rarely Sees Such Weak Demand
Ontario has seen the biggest dip, with the ratio falling to 40% — a level it has only seen once before in the past 25 years. That was during the 2008/2009 downturn, when the market slowed though it didn’t particularly see a big dip, having only recovered to 1990-levels in real terms at this point.
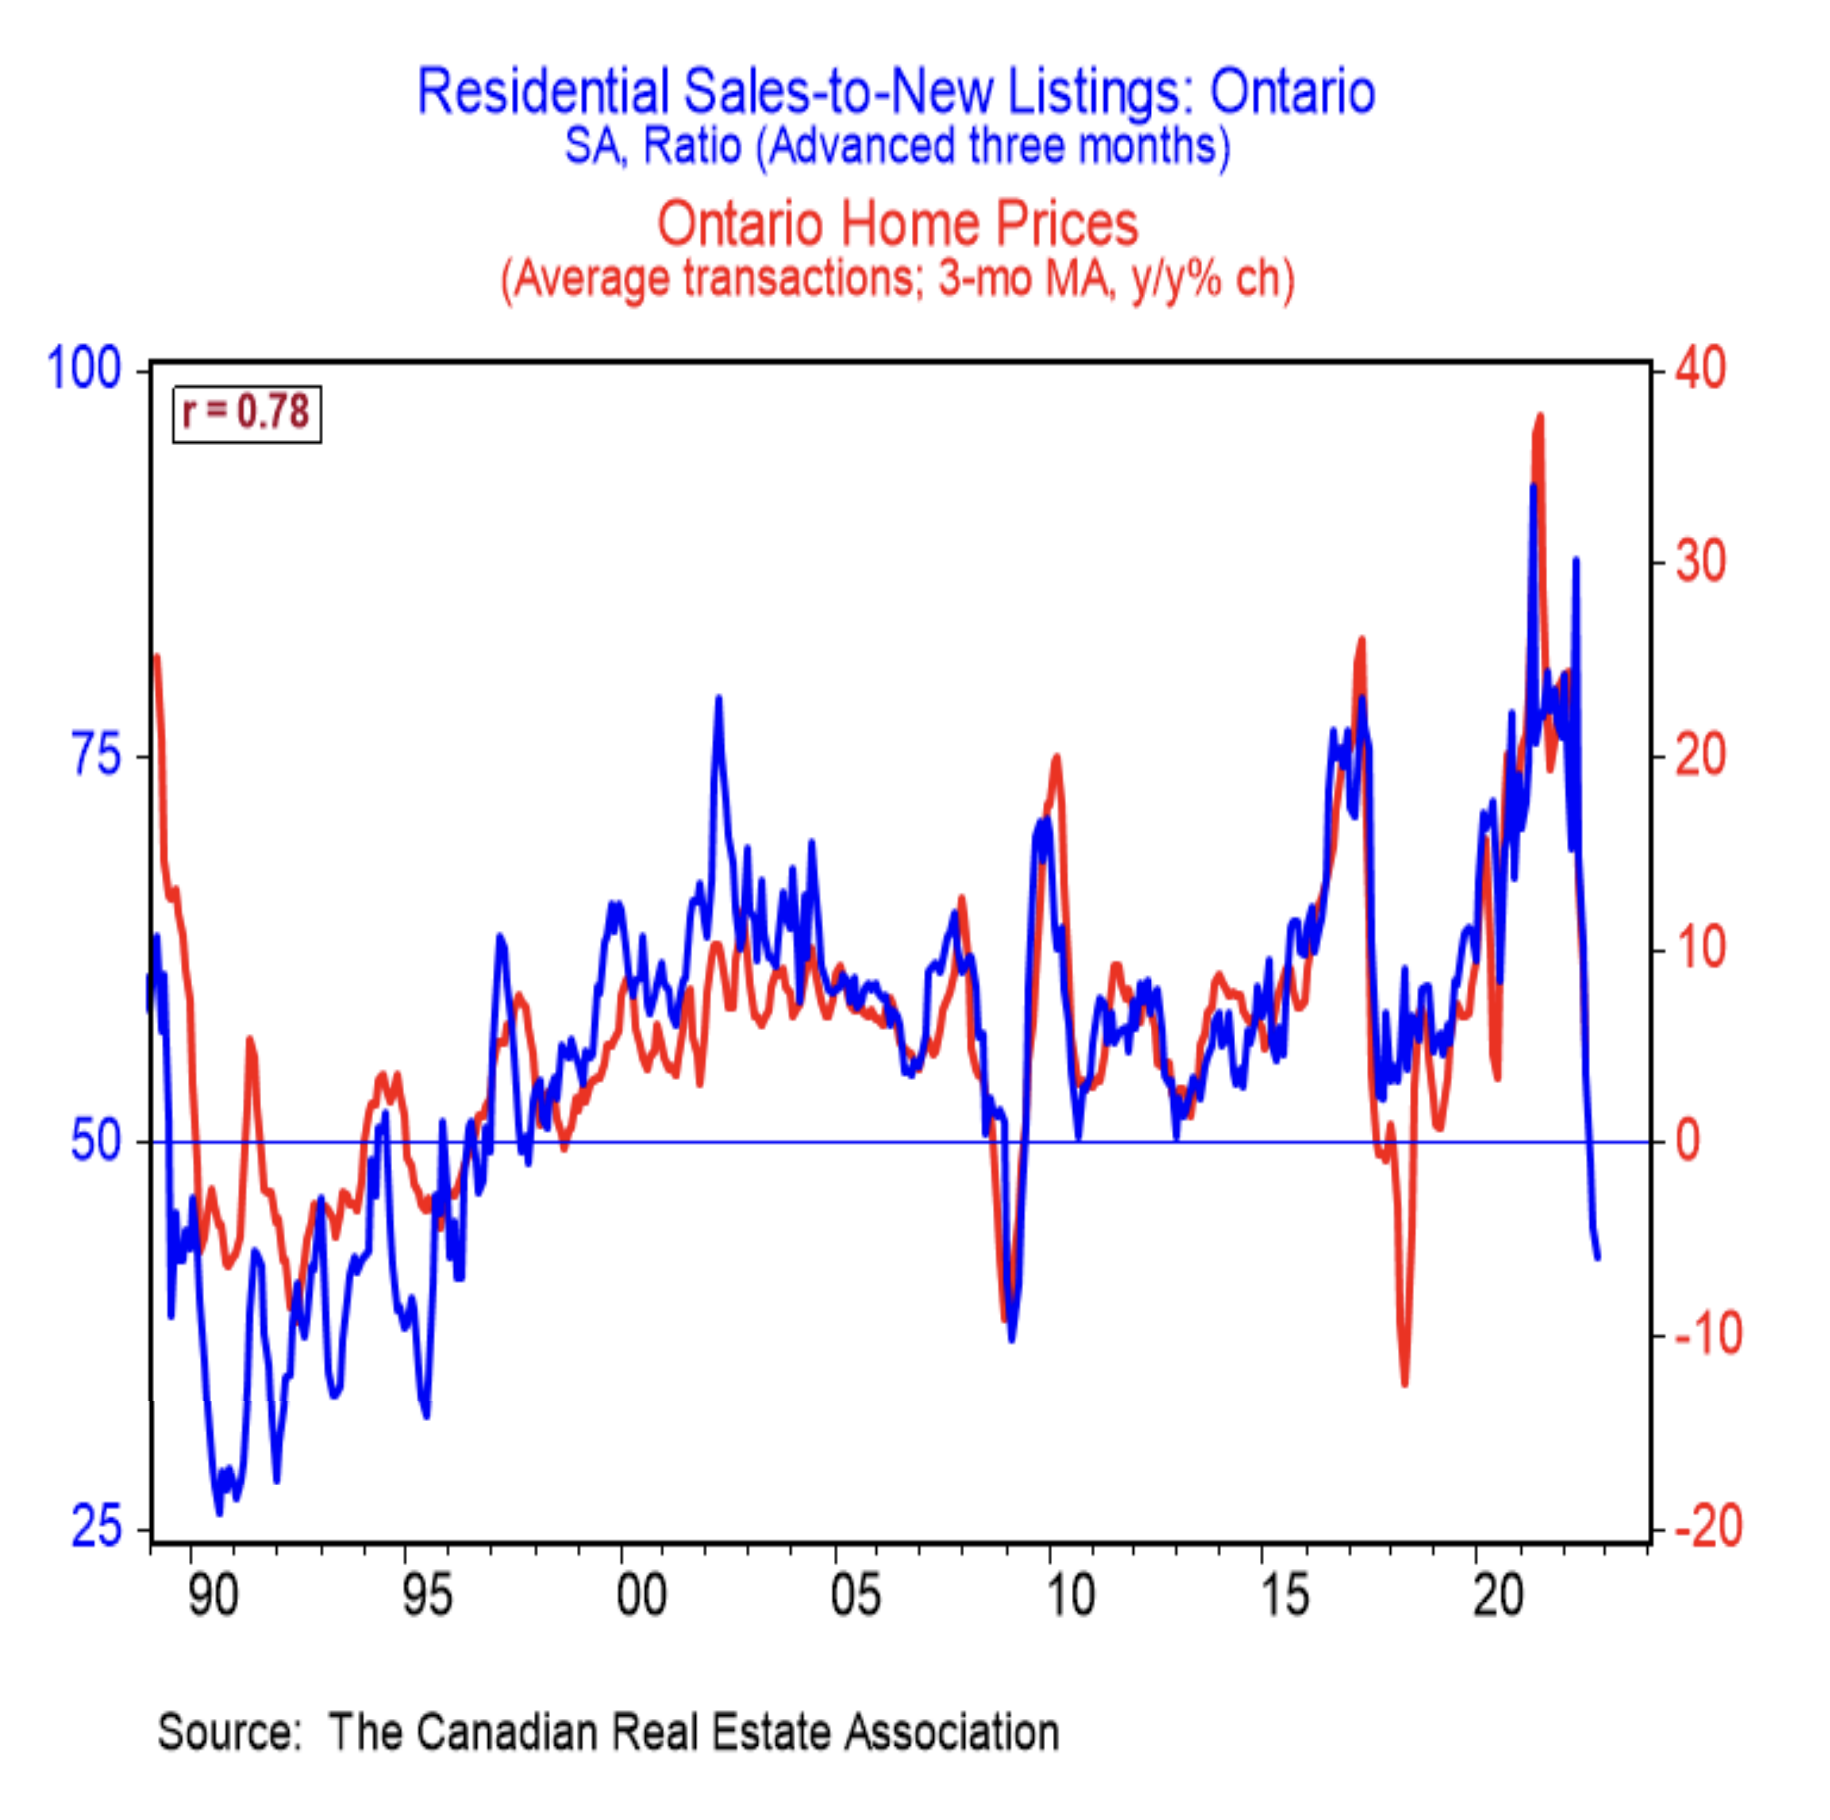
The above chart shows Ontario’s average home price growth and its SNLR. BMO estimates the SNLR leads home prices by 3-months, so they pushed it forward by that much. The result is a picture that appears to be heading getting worse in the near future.
Porter explains, “prices have famously started to drop in many Ontario cities in recent months, including the GTA, but they’re still up a tad from a year ago. This ratio says there is more weakness coming, and soon.”


